Economics 101: when a buyer knows the true cost of something, they make better buying decisions. Unfortunately, we have found that most left-of-center campaigns, causes, consultants, and central committees have very little insight into what different types of Digital ads actually cost.
There are a lot of factors that create this opaqueness:
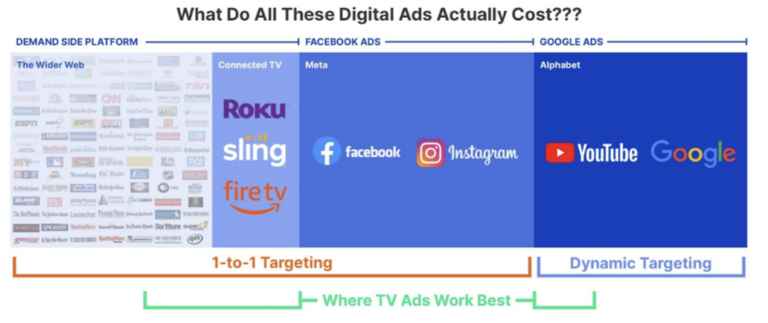
- Each ad platform functions differently and typically costs very different CPM’s (Cost Per Thousand Ads, the standard Digital ad unit of inventory). Facebook Ads, Google Ads, and Demand Side Platforms give advertisers access to all different types of ads, each at a different price. Even within platforms, inventory costs vary: For example, Youtube Skippable and Non-Skippable inventory typically cost different amounts. It can all be very confusing.
- Vendors price their ad buy services and Digital ad inventory in a variety of ways. Some are transparent and charge a % placement fee above what the ads cost in-platform (what we do), some offer inventory at a fixed price (a mistake in our books), and some kind of just lump everything they do into one sum and respond with a ¯\_(ツ)_/¯ when you ask them how much they are charging to buy Digital ads for you.
- The poli-digi space does not naturally breed expertise in how real-time programmatic digital auctions work. You don’t learn it working on a campaign, and traditional media firms that are used to the “Direct Buy” method of purchasing advertising often find the real-time auctions alien to them. As such, many folks who are considered experts by campaigns and causes have trouble providing clarity on basics like ad price.
Knowing what Digital ads cost can provide huge value to campaigns by enabling them to keep their vendors honest on their pricing and helping them spotcheck that their vendors are navigating ad auctions in their best interests. With the help of COMPETE’s awesome Ad Tech team, we’ve put together costs for the main types of ads that we buy for our clients, using hundreds of campaigns worth of data from the past 5 cycles. This newsletter will focus specifically on 2021 General and 2022 Primary data and trends, which provide the most insight into what to expect in the pending General election. We find the trends incredibly informative, and we hope you do too!
Before diving into the data, some clarifications and definitions:
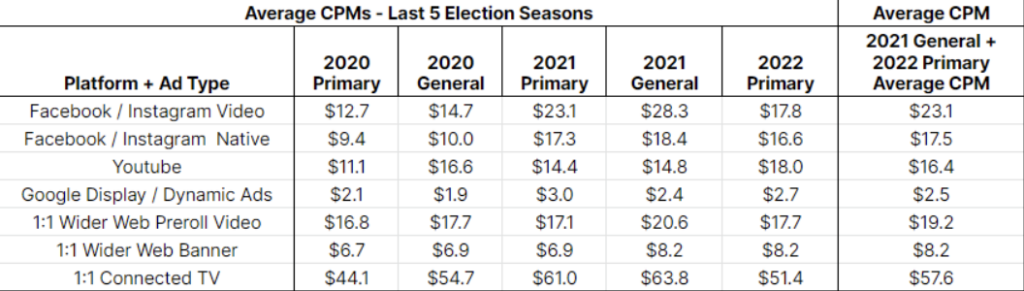
- All data presented are the cost we paid directly to ad platforms: it does not include our ad placement fee or any other service fees.
- Our data focuses on our “Primary Digital Platforms for Political Campaigns” in the graphic above: Facebook, Instagram, Google Display, Youtube, and the Wider Web + select Connected TV (CTV) assets.
- Our data on Facebook, Instagram, and the Wider Web + CTV is almost exclusively data from campaigns that are 1:1 targeted using a voter file. Campaigns using non-1:1 targeting techniques are typically much cheaper on these platforms, which makes sense—we are willing to pay more for better targeted campaigns and higher value targets!
- Google and Youtube do not let political entities 1:1 target, so our data on these platforms is from campaigns using what we call “Dynamic Targeting”, where we’ll use assumptions to get in front of the proper target audience. For example, Democratic voters can likely be reached by buying ads on Rachel Maddow’s Youtube channel to folks over 25 in the right geographic area.
- Inventory costs can fluctuate greatly depending on geography and time in the election—if you’re in South Texas running in an area without a ton of competitive races, your ads will likely cost significantly less than the average numbers we present below. If you are running in Manhattan, in an area with lots of folks advertising to the same voters as you down the stretch of an election, you will pay significantly more.
- We did not include inventory pricing for non-1:1 targeted CTV ads that are bought directly or through a private marketplace at a fixed cost. Although the amount of CTV inventory that can be 1:1 targeted is rapidly expanding, it presently comprises only a small portion of the overall CTV pie. For the vast majority of our campaigns, we only buy 1:1 CTV, so that’s what we included in our data.
For reference on what these different ad types look like, here are preview links for a recent client of ours:
Facebook / Instagram 30s Video
Facebook / Instagram 15s Video
Facebook / Instagram Native Carousel
Youtube 15s Non-Skippable
Youtube 30s Skippable
Google Display / Dynamic Ads
1:1 Wider Web + CTV Pre-Roll 30s Video
1:1 Wider Web + CTV Pre-Roll 15s Video
1:1 Wider Web 300×250 Banner
Note that you’ll have to be logged into Facebook to view the Facebook previews, and that the Youtube and Google ad links expire after a little while and may not work if you read this post a few weeks after it originally goes out.
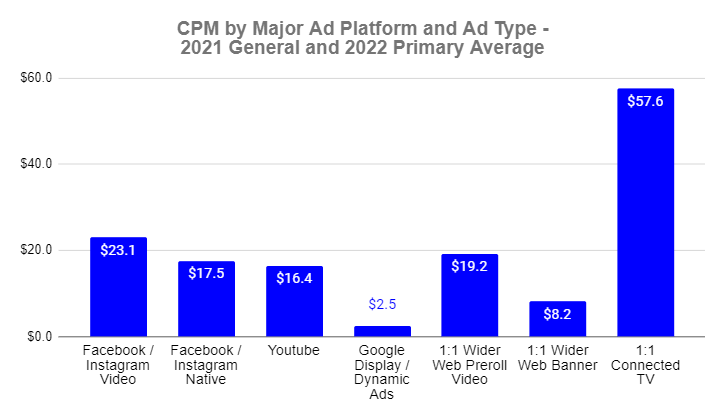
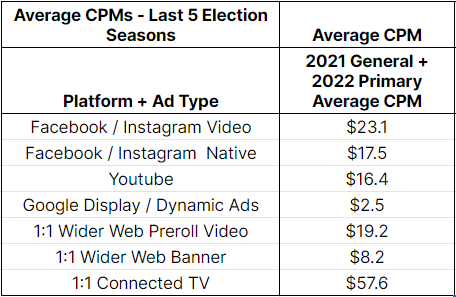
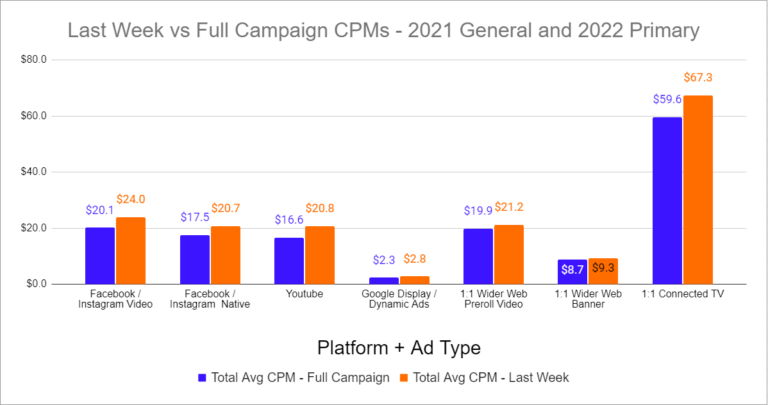
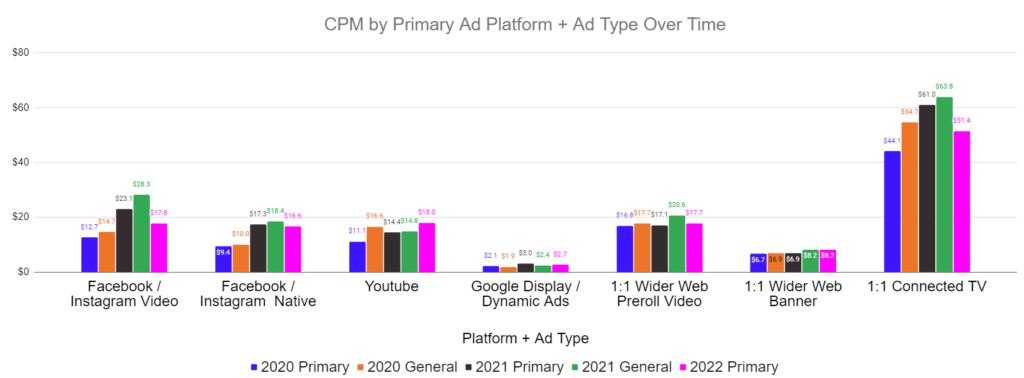
Over the last 2 elections, these are the average costs we’ve paid to buy ads directly on the major ad platforms + ad types. You can see that the general cost hierarchies of
- Connected TV > Non-Connected TV Video > Static or Banner ads
- 1:1 Targeted Inventory > Non-1:1 Targeted Inventory
Still apply: advertisers are willing to pay more for higher quality and better targeted spots. Comparing these numbers to what your vendor is projecting in their proposals or what they are guaranteeing may help you get a better deal!
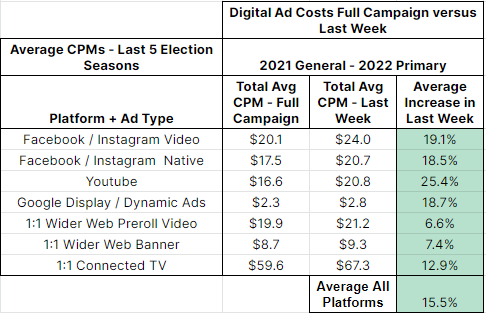
We’ll get into trends on each platform a bit later, but first, let’s look at how the trend of ad inventory prices increasing at the end of elections is holding up. Last year, we found that prices increased on average about 10% during the last week of an election across all platforms. What have final week increases looked like since then?
Costs continue to increase significantly on all platforms in the last week of the election. This is typically a result of:
- More advertisers entering the market at the end of elections
- Advertisers trying to spend larger final week budgets and bidding more to do so
Now, let’s take a look at platform specific trends.
We group these two ad platforms together because
- They are both bought through Facebook Ads and can 1:1 target the voter file
- Their inventory prices and ad formats are similar
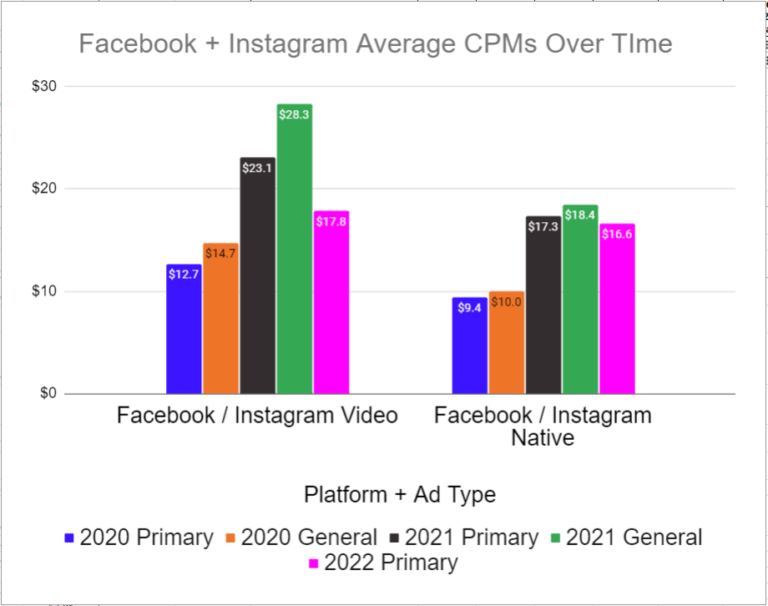
It’s been a wild ride for Facebook over the past couple of years. Our 2021 General CPMs (green in the graph) are likely inflated, as we did a lot of buying in swing Virginia Legislative races. Because it’s the biggest game in town in the off-year, and receives more focus and competition than other states in the even year, VA costs get bid up. That said, the drop off from 2021 to 2022 is still pretty stunning. We think there are a few factors at play here:
- Facebook was once the apple of every political advertisers eye. We certainly saw it as the most overused and overbid platform (although still very effective!). Between Facebook claiming they are weakening their political targeting methods and the shrinking of their user base, Facebook’s demand with political advertising firms appears to have taken a hit. Political advertisers are probably collectively spending less on Facebook than we used to, so costs aren’t getting bid up as much.
- Corporate America, fearing a recession, may have pulled back their advertising budgets on Facebook in particular as a result of some of the same negative Facebook news + the whole Meta thing. This would also contribute to creating less competitive bidding atmospheres.
At COMPETE, we find the reports of Facebook’s demise greatly exaggerate. Although we are spending slightly less on it than last cycle as a % of the total budget, we still find its ability to saturate a target audience to be incredibly strong. Also, everyone should know that Facebook’s political targeting changes did not include removing the ability to 1:1 target a list of voters. Until they remove this option, their platform’s effectiveness for political advertisers will remain potent.
We are glad to see the drop in Facebook and Instagram costs in 2022, as we did find the platform to be fairly overpriced given the quality of the average spot (mostly mobile news feed spots that can be scrolled by, the sound starts on mute, and ads must be interacted with to turn sound on). Whatever your thoughts on Facebook ethics and its role in our political discourse, it appears to be getting cheaper to buy ads on, which is good for advertisers.
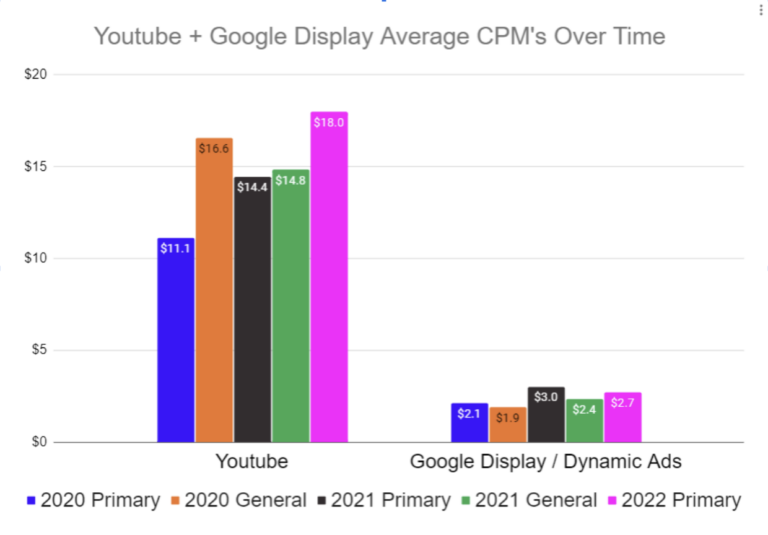
Google Display has seen an unsteady rise in cost over time. We personally consider Google Display ads as undervalued overall by the political market. Yes, they are not very targeted, and they are typically simple static ads (although some spots will be video ads if you set up your campaigns properly!). Weighing heavily on the other side of the ledger: They are just so gosh darned cheap!
Youtube had the largest jump of any platform from the 2021 General to the 2022 Primary, and appears to be the main beneficiary of advertisers looking for alternatives to Facebook. We also think that the increase is being fueled by traditional media firms looking for more digital inventory that seamlessly fits their formatted-for-TV ads.
We want to go a bit deeper on Youtube, as there are a variety of different ad types within the platform that you should be aware of:
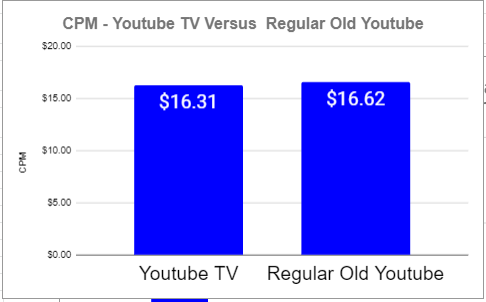
Youtube TV: Youtube’s Connected TV offering. These Ads are served on a TV screen through the Youtube app on a Smart TV. Bigger screen = typically more valuable.
Regular old Youtube: Youtube ads served on mobile phones, tablets, or computers. Smaller screen generally = should be less valuable.
Youtube TV has exploded over the past few years — it has accounted for 42% of our total Youtube spend for political campaigns over the past 2 election seasons. This increase is great for digital advertisers who can leverage Youtube, as it presents the opportunity to serve more rich, persuasive, TV-style ads to voters using the superior targeting that digital ad auctions offer.
How are advertisers valuing the different devices that voters watch Youtube on?
Both Youtube TV and regular old Youtube serve more or less the same type of ads. The two most prevalent types that we buy are:
Non-Skippable Ads: 15 second ads that the user has to watch all the way through. They can’t skip them.
Skippable Ads: Ads of any length that the user has to watch the first 5 seconds of and then they are able to skip (most users do).
How does the market value these different types of Youtube ads?
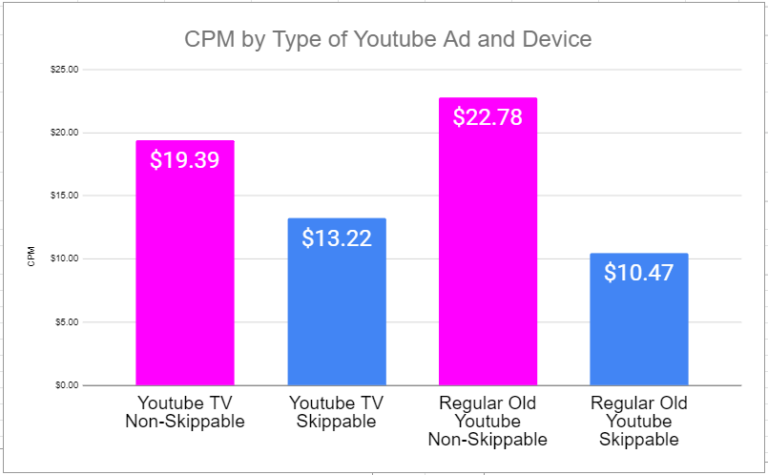
Clearly, advertisers value Non-Skippable as the more valuable spot than Skippable. This makes perfect sense, as Youtube users overwhelmingly choose to hit the skip button after the first 5 seconds on Skippable ads, so 15 second Non-Skippable usually gives advertisers 3x the time to deliver the message. Also, unlike the set-up for Youtube TV versus Youtube Phone/Tablet/Computer targeted campaigns, which all get chosen within the same campaign, you have to set up Skippable and Non-Skippable Youtube campaigns separately. This forces advertisers to think about how to bid differently for the different ad types.
Overall, even though the rest of the market appears to be wising up, we still see Youtube as a hugely undervalued ad platform. More and more folks, in increasingly older demographics, are using it through Youtube TV. Lots of them are voters. Youtube offers a Connected TV experience for about 30% of the price we pay to buy 1:1 Targeted CTV on other platforms. Although Google doesn’t allow political advertisers to 1:1 target the voter file on Youtube, when the costs are that much lower, you are able to buy so many more ads that the less accurate targeting doesn’t really matter… Although, this assumes that the Youtube campaign is set up properly by your vendor, which is not a given.
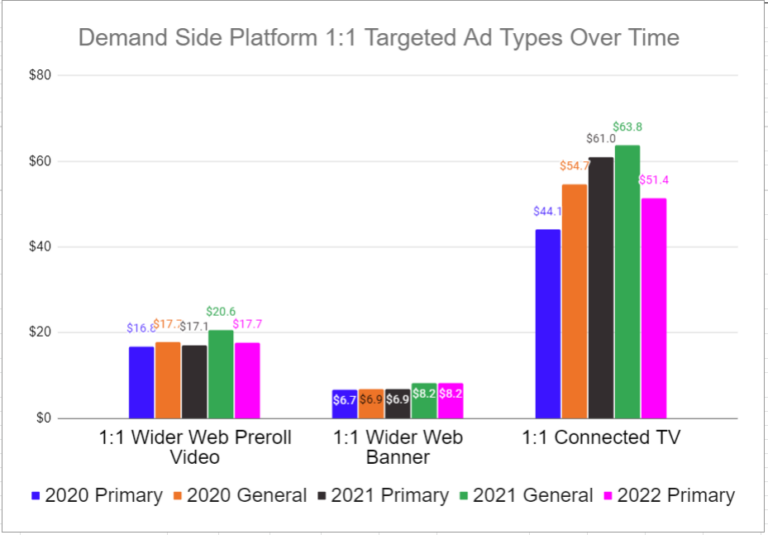
Let’s start by looking at Connected TV, which, when we did this exercise last year, was seeing the biggest increase in CPM election over election. It dropped off significantly in the 2022 Primary. This drop off is interesting, and the size of the change may be a quirk of our data set. However, there are some relevant market forces that are likely driving this change:
- Most importantly, more and more CTV platforms are offering 1:1 targeting, or are offering 1:1 targeting for a higher percentage of their inventory. CTV platforms that have seen a notable increase in 1:1 inventory that we can buy targeting the voter file include Samsung TV (our biggest riser), Philo, and Tubi.
- As noted in previous sections, we believe traditional media firms are finding other options for deploying their ads effectively. Youtube Non-Skippable’s increasing demand and price is the main example of this.
We’re sure there are other things going on here to drive the CTV price drop. We are admittedly not the foremost experts in the Poli-Digi space on CTV market trends. It will be interesting to see if the drop continues into the typically more competitive General Election season.
Moving on to the other main DSP ad types, it is notable that 1:1 Wider Web Pre-Roll video prices have been essentially flat for the last 2 years. Pre-Roll Video comes in a variety of formats –sound on, sound off, taking up most of the screen versus just a fraction of it, 5 second skip versus 15 second non-skippable, etc.–and our data shows the average price for all of them. That said, a lot of this inventory is similar in value to a Facebook News Feed spot–the spot starts on mute and must be interacted with to have the sound turned on, it can be scrolled by easily, it is increasingly more likely to be on a mobile phone and smaller as a result, etc. Perhaps advertisers are wising up to the true value of these spots–still valuable, but not worth paying through the nose for. The flattening could also be driven by supply outstripping demand and inflation. It’s hard for a lowly services provider like COMPETE to know this for sure, given the sheer volume of websites that enter and exit the Demand Side Platform market each year.
We’re a bit stumped as to why 1:1 Banner CPM has increased significantly while 1:1 Pre Roll Video has flattened out. It seems like the market trend for these ad types would be the same. Perhaps it’s a result of more and more mail firms offering digital and 1:1 targeted banner ads offering them the most direct “Mail to Digital ad” transition for their content? Speculate wildly!
What are we expecting for the 2022 General? We expect a slight increase in costs across the board. We also expect platforms that had big drops from the 2021 General to 2022 Primary, like Facebook and CTV, to largely rebound, while ascendant platforms like Youtube should continue to rise. All of our programs are built off of these estimated prices, along with our theory of what it takes to get a target voter to “Saturation” on the different platforms.
Hopefully this breakdown is helpful as you think about utilizing Digital to reach and persuade voters in the upcoming election season. If you’ve made it this far, you may be a spreadsheet brain type like some of us COMPETE folks, and would get pleasure from seeing all the data for all elections in one place. If so, see below and enjoy!
Zach Mandelblatt
President
Zach@CompeteEverywhere.com
503-819-6778