Our analysis of how the exploding New Media landscape priced out and changed in the Presidential year
Last year was marked by monumental evolutions in the Media landscape. More Americans cut the cord, with Broadcast and Cable giving up 4% of their aggregate market share to Streaming and Other, according to Nielsen. Digital and CTV markets continued to grow rapidly as an increasing number of Media channels began offering their supply through more efficient Programmatic Ad Auctions. This has put the skills of Digital ad buyers (experienced navigators of Programmatic Ad Auctions) more in demand for crafting and executing effective “New Media” programs (New Media is our term that groups together traditional Digital platforms and CTV). Campaigns and causes across the country either adapted to the New Media landscape — or didn’t — leaving votes and influence on the table.
While we find more titillating post-election analysis about campaign messaging (“Did the anti-trans ad win Trump the election?”) and emerging platforms (“Did Joe Rogan’s podcast win Trump the election?”) interesting and important, we believe that mundane analysis of New Media ad prices and other trends (the subject of this article) can yield insights that will have just as big of an impact on the effectiveness of next cycle’s campaigns. If the record-setting billions spent in November’s election could have been 10%-20% more efficiently allocated through a deeper understanding of New Media — which we consider a reasonable proposition — the left-of-center ecosystem would benefit greatly.
We have aggregated data from the hundreds of campaigns we ran in 2024, as well as our data from every year since 2020, here for your benefit, alongside analysis of the most important trends we see from the data. You can find all of this by platform at the end of the article.
Before analysis of the platforms, a few preambles:
- Our 2024 data set is built from 369 different 2024 campaigns: 60 Super Tuesday Primary primary races, 32 non-Super Tuesday Primaries, 239 General election races, and 38 Advocacy / Public Affairs campaigns.
- These are the base prices of the inventory, as they priced out in the various ad auctions, before any agency fees are applied.
- In past years, we’ve broken out Primary and General election data separately. Since we now have 5 full years of data to look at, we decided to consolidate it into full years to keep the data from becoming too unwieldy. As in previous years, 2024 prices in Primaries were generally a bit cheaper than in General elections, although this trend is not a hard and fast rule.
Now for the general analysis and trends!
CTV Supply Increased While CTV Prices Stayed Low
You would think that the increased market share of CTV, and thereby its importance in the ecosystem, would result in its overall price increasing as advertisers move budgets to CTV ad platforms from other channels giving up market share. Instead, we saw the opposite. CTV ad prices generally decreased or came in lower than expected for new supply like Roku’s Ad Auction. Generally, it appears that the demand for CTV advertising is not keeping pace with the increased supply these platforms can offer as a result of more Americans cutting the cord. As a result, we’ve seen price drop each of the last 4 years:
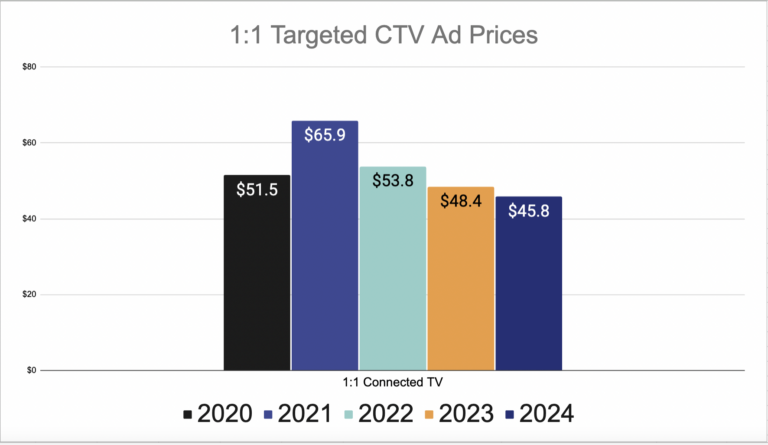
As 30-second TV-style ads that are targeted to the voter file, 1:1 CTV ads were already Tier 1A priority for us when crafting a campaign’s budget. The lowered CPM they commanded in 2024 reinforces for us their top-of-the-food-chain ranking.
Moving to Roku and Hulu, which both rolled out their own ad auctions during the 2022 cycle, we see an interesting divergence in price for the same quality of inventory (30-second Non-Skippable TV-style media).
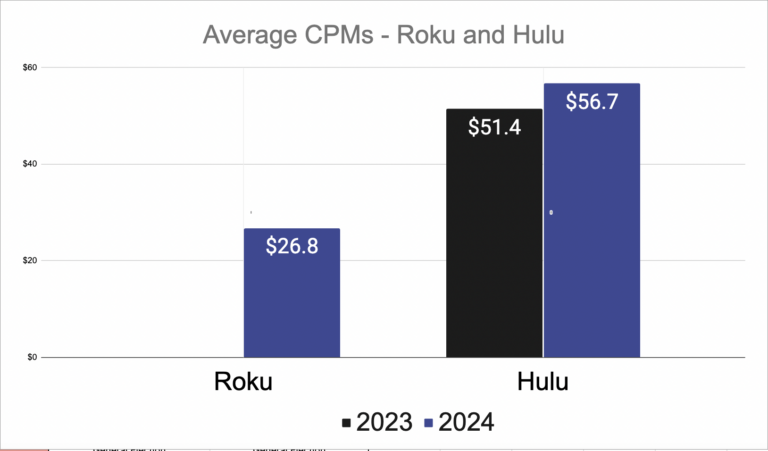
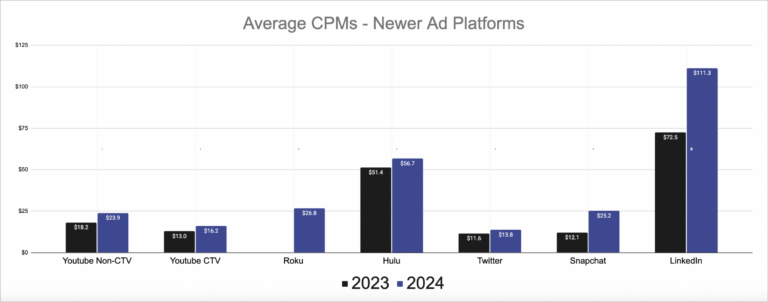
Roku came in at an impressive $26.8 CPM in 2024 — less than half of Hulu’s $56.7 average. By our evaluation, Roku also offers better targeting techniques than Hulu, and a higher overall market share — about 7.5% of American households use a Roku device, compared to the 2.9% that Hulu currently commands. Advertisers clearly value Hulu inventory more than Roku, perhaps based on the strength of the Hulu / Disney brand. However, we believe that the much lower price, better targeting, and higher market share that Roku offers makes it a much better buy than Hulu presently — so much so that, going forward, Roku is going to move up into the same category as YouTube in our Tier ranking of which platforms to fund first.
YouTube Went From Undervalued To A Bit Overvalued (At Least for Non-Skippable )
In last year’s edition of this Price Trends article, we recommended that campaigns start buying more YouTube. In 2024, we saw the market seems to have agreed with us, as YouTube jumped to well over the 10% Market Share, providing even more reason for campaigns to seriously consider investing. Very important note: This YouTube market share figure does not include YouTube TV, which Nielsen classifies as linear streaming via vMVPD apps, and which it includes in Cable and Broadcast’s market share.
Unlike traditional CTV bought through an agnostic Demand Side Platform, advertisers kept up with this increase in YouTube market share, as we saw average price increase significantly from 2023:
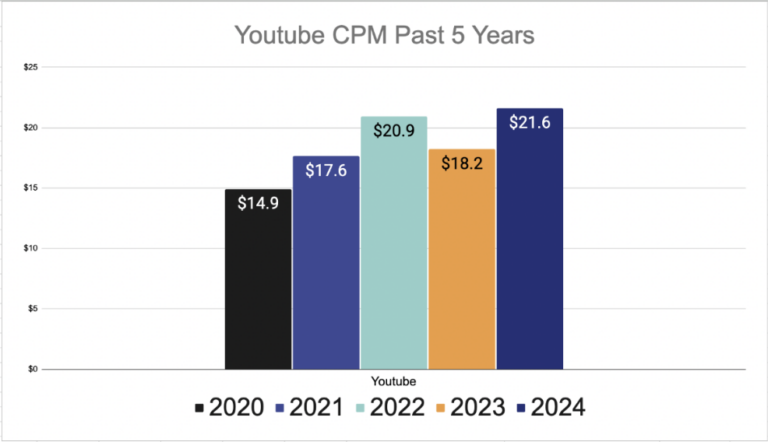
From our vantage point, in the trenches buying YouTube for hundreds of campaigns, we did see a couple of changes that made us think YouTube’s status as “undervalued” should be reconsidered.
- The first and most obvious reason is the significant increase in CPM for YouTube even as most other “TV-style media” prices fell.
- Second, we saw YouTube struggle to fulfill the budget we allocated to it in a significant percentage of our races that had strong New Media budgets. We believe that YouTube’s “smaller than expected” available market share is driven by a few factors:
- More campaigns are bidding for YouTube and sucking up the inventory.
- YouTube rolling out “YouTube Select,” offering 30s Non-Skippable ads for the first time to advertisers willing to buy premium inventory on a more traditional model that requires upfront commitments and early reservations.
- More “top-of-market” campaign entities (Presidential, Senate, and Congressional IE’s) are reserving buys early with YouTube in the same manner they have traditionally approached Linear TV early reservations.
YouTube is large enough now, with so many different inventory types, that we want to take a deeper dive into the different prices of different types of YouTube ads.
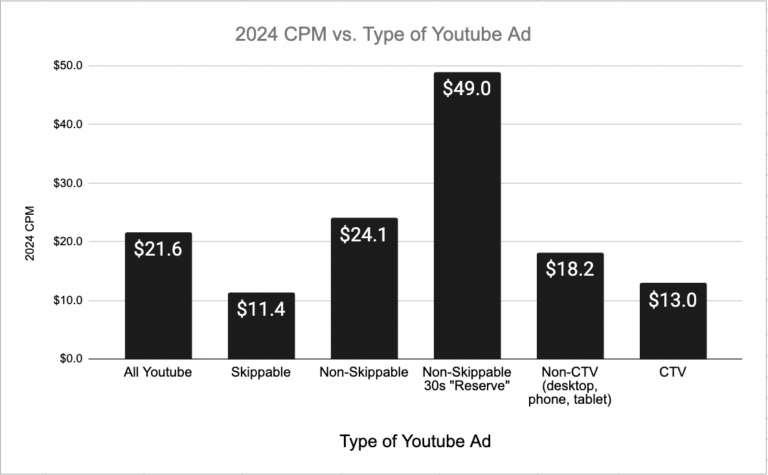
The graph above reveals a couple of interesting YouTube pricing takeaways. The first is that YouTube CTV — which we classify as YouTube being watched on a Smart TV as opposed to on a desktop, phone, or tablet — continues to cost less than Non-CTV inventory. As in 2023, we still don’t really understand why this is happening, but it reinforces for us that this inventory type is undervalued and we should continue to bid aggressively for Smart TV devices within the Google Ads Auction (where YouTube is bought and sold).
The second takeaway we go deep on in the next section.
The Resurgence of Skippable YouTube Inventory?
We saw the two main types of YouTube inventory — Skippable (ads of any length, able to skip after 5 seconds) and Non-Skippable (15-second ads that must be 100% watched) — diverge even further in price than in previous years, with Non-Skippable for the first time coming in at more than double the price of Skippable. We also saw Non-Skippable 30s “Reserve” inventory come in at a hefty $49 CPM, about double the cost of 15s Non-Skippable. This got us thinking — is Skippable now being undervalued? Since YouTube rolled out the 15s Non-Skippable inventory type a few years ago, we have typically bought Non-Skippable inventory first, since the forced view of a 15-second ad to completion is, in a vacuum, more effective than an ad of any length that can be skipped after 5 seconds.
But now that the price has diverged so much, we want to poke at this assumption. To do so, we looked at the average number of seconds watched for YouTube Skippable ads on well-funded campaigns that deployed a 30-second ad. This table shows the average length of time these Skippable ads were watched in the sampled campaigns:

We were surprised to see that over 30% of the 30-second ads we ran on Skippable for these campaigns were watched to completion, as we assumed this number would be much lower.
Using this data, we have coined a new statistic called “CPM Per Second” — How much did each type of YouTube inventory cost to generate 1 second of watch time?

Skippable inventory costs less than half as much to generate a second of watch time than either type of Non-Skippable inventory. Given this, plus a few other factors:
- The first 5 seconds of an ad is typically the most valuable 5 seconds, another feather in Skippable’s cap.
- The YouTube Non-Skippable’s CPM of $24.1 compares unfavorably stacked up to Roku, which has similar targeting capabilities, a similar CPM of $26.1, but largely offers superior 30-second Non-Skippable inventory.
- In addition to its hefty $49 CPM, Non-Skippable 30s “YouTube Reserve” inventory is severely limited in its targeting capabilities (basically, you get zip + demographic targeting and none of the more advanced targeting options that YouTube offers).
We think it is a reasonable conclusion that Non-Skippable is overvalued and that Skippable is undervalued on YouTube. We will be adjusting our YouTube media planning accordingly!
If you agree with our takeaway that YouTube Skippable seems undervalued and should demand more budget, a note on ad formatting: make sure you craft your YouTube Skippable to “pop” and deliver the high-level message in the first :05 so you get the most out of the part of the ad that is a forced view. This often leads to less creative ads than what you can do with non-skippable 30 second ads — another trade-off for getting the lower Skippable price.
Meta (Facebook and Instagram) Continues to be a Great Buy
As we have asserted the past few years as Meta’s star has fallen, we believe that Meta’s demise has been greatly exaggerated. Since it shed a bunch of advertisers through some unforced errors in 2022 (have you heard much lately about the Metaverse?), its inventory price dropped. This year, it dropped even more, reverting back to the rock-bottom levels we saw in 2022:
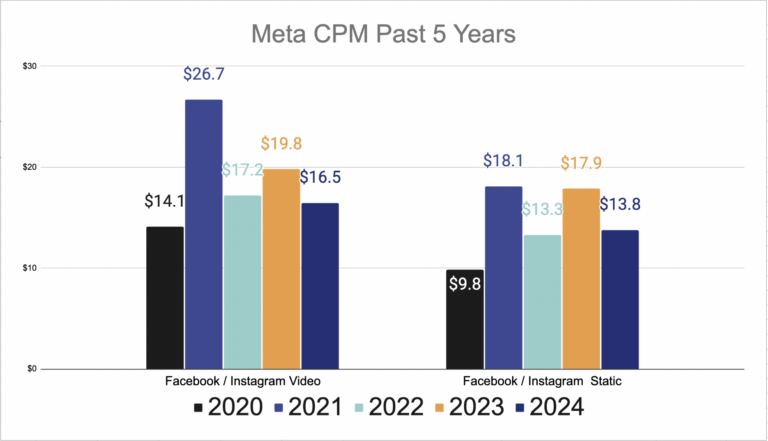
Note: As the next section on price fluctuations lays out, advertisers in competitive elections often pay significantly more on Meta (as much as 2-2.5 times) than the overall national average.
Given Meta’s low price, the continued high % of the average target audience that can be saturated on Facebook and Instagram (much of the user base Facebook has lost, which is only a small amount, Instagram has been picking up), and its excellent 1:1 targeting methods, we still believe that optimal New Media programs should be funding Meta as one of the first priorities.
Prices Varied Wildly From Campaign to Campaign Across the Country
The campaigns and partners we work with rely on us to accurately forecast what ads will cost to craft the most effective New Media programs. 2024 reinforced that there can be huge price variance for individual platforms, and that nailing the projection as accurately as one can with Cable or Broadcast is a difficult task, even for firms like ours who rigorously attempt to do so. Below you can see, by platform, how the average CPM compares to the lowest and highest CPM campaigns we ran:
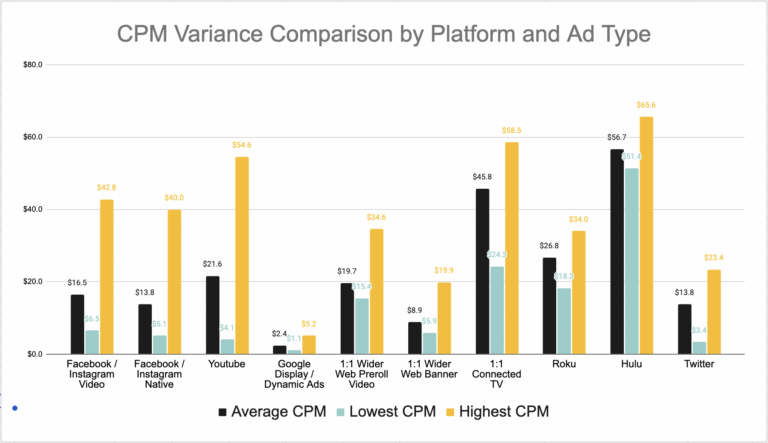
Although more traditional “Digital” platforms, like Facebook, Instagram, Twitter, and YouTube had wider fluctuations than CTV platforms, across the board we saw a wide variation in what the end price registered as for our biggest outlier campaigns.
The table below lays out the average CPM by platform, how the average compares to the highest and lowest CPM’s garnered by any campaign in 2024 for each platform, and information on the outlier campaigns (where the race was, if it was competitive, if it was a General vs a Primary, what kind of race, etc.):
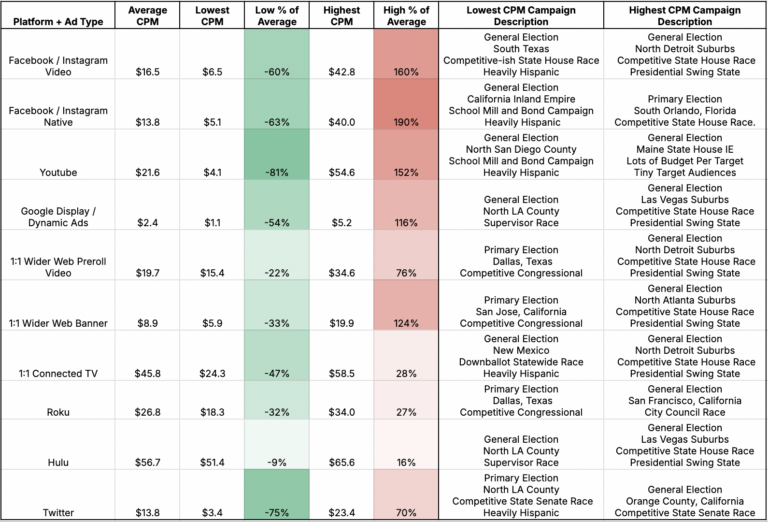
Generally, prices increased or decreased similarly to how we’ve seen in the past based on the following inputs:
- The standard price of the Media market. Corporate America advertising provides the baseline price for a given target audience in the different Media markets, resulting in places like New York City on average being more expensive than places like South Texas.
- How competitively the target electorate is being bid up by other political advertisers. Our most expensively priced campaigns were generally in Presidential swing states, in districts that also had competitive State House races and Congressional races bidding up the price of inventory alongside the Presidential. Many of our cheaper campaigns were where we were the only ones buying for a particular target audience, like a School Mill and Bond campaign with no opposition.
- General elections were a bit more expensive than Primaries or Advocacy campaigns.
- The more dollars per day, per target, a campaign had to spend, the more expensive the inventory, as we would have to bid more aggressively to fully place the buy. This is one of many reasons we encourage our clients to start planning, and, if budget allows, deploying their New Media campaigns as early as possible!
However, none of the above were a hard and fast rule — for example, you can see in the table above that on two different platforms we saw our cheapest inventory come from two separate highly competitive Democratic Congressional Primaries, one in a fairly average priced Media market and one in an above average priced Media market. You would think that the campaigns in these Congressional Primaries would be bidding against each other to drive prices up, and that the Media markets would have provided a higher baseline CPM — that reasonable assumption is wrong in these two instances. This reinforces for us that even the most wise forecasting cannot possibly be accurate as some of our partners may want, and that we must be able to explain why Programmatic Ad Auctions fluctuate to our partners so they understand what to expect and are prepared if a given campaign’s prices deviate from what could be reasonably assumed.
A new trend we noticed more strongly this year is that, across the country, target audiences with larger Hispanic populations were much cheaper than the already lowered forecast we set for them when we were crafting proposals. You can see this manifest in the majority of the lowest CPM campaigns listed in the table above coming from campaigns targeting Hispanic audiences.
Wrapping up this section on price deviation — our biggest takeaways for altering our New Media campaign planning going forward are:
- We should further decrease the expected CPM for Hispanic-heavy target audience campaigns than what we were already doing.
- In the past, we have reduced our projected CPM at the same proportional rate for all platforms. We need to make the CPM adjustment larger for Social Media platforms and YouTube, and less for CTV, as CTV fluctuates less than traditional Digital platforms.
- Due to the variance and unpredictability in price, any advertiser — agency, buyer, or otherwise — offering their clients New Media inventory at a fixed price is doing it wrong. Campaigns and causes should reject any New Media plan built off of a fixed-price model.
2025 and Beyond
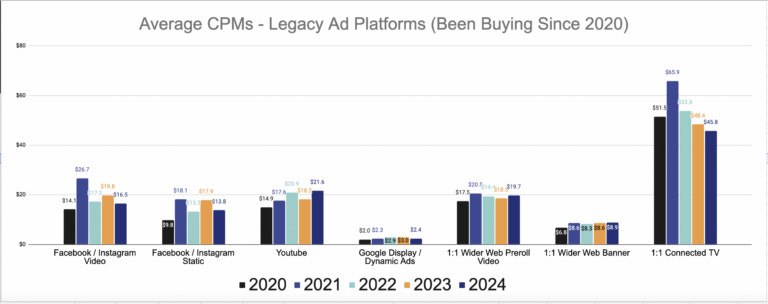
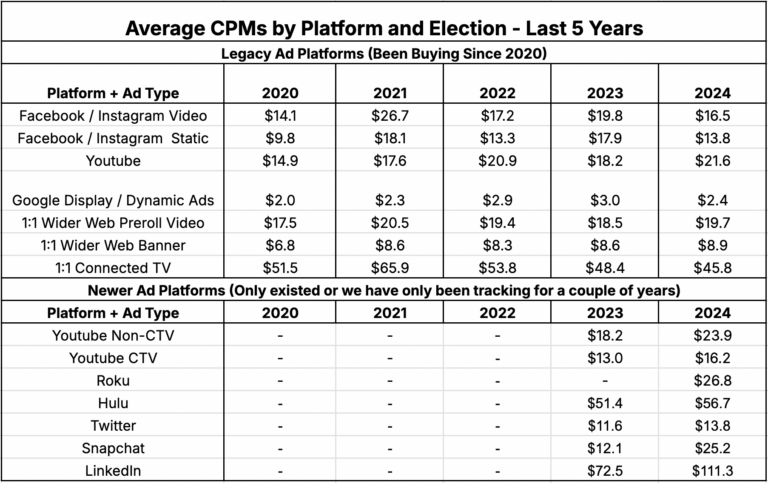
If you have made it this far in the blog, I commend you for being a fellow connoisseur of excruciating (but important!) details. If you’re looking for the raw data for all platforms (including the ones that we haven’t drilled in on) — below it is grouped into “Legacy” Digital / CTV ad platforms (ones we have bought a lot of every year since 2020) and “New” Digital / CTV ad platforms that have only had their own Programmatic ad auctions for a year or two (like Hulu and Roku) or that only recently started offering political advertising (like Twitter/X).
As we look to 2025 and beyond, one of our main goals is to provide our clients and partners with better tools to analyze the impact of New Media (Digital and CTV) compared to Traditional Media, and how to provide the left-of-center ecosystem with more knowledge to better understand New Media. We hope this will help our partners and clients better utilize New Media to achieve their goals. In this vein, we are currently working on a project that I am very excited about, and hope to be able to share with you soon.
Any questions about our data or takeaways from 2024? You can reach me at the information below. Happy New Year.
Zach Mandelblatt
President
Here’s that same data in graph form:
