Analyzing our data just in time for election season
We Democrats and our allies agonize (for good reason!) over key inputs to the success of our paid media campaigns, such as:
- Raising the last little bit of our fundraising goals.
- Carefully crafting the campaign’s message for maximum impact with voters.
Getting that last 15% of value from the money and message takes up a huge amount of the average campaign’s resources and brainpower.
Here at COMPETE, we are surprised that the same energy is not always applied to understanding price trends on the media we use to communicate – especially New Media (Streaming, Social, Internet, etc). Getting a 15% better price on media yields the same positive outcome as the campaign raising that last 15% of its fundraising goals***. Similarly, a better price projection and understanding of ad platform capabilities can lead to a 15% more effective strategic allocation of the campaign’s media – no different than how the perfectly crafted message can yield the last 15% of “vote value” from the campaign’s budget.
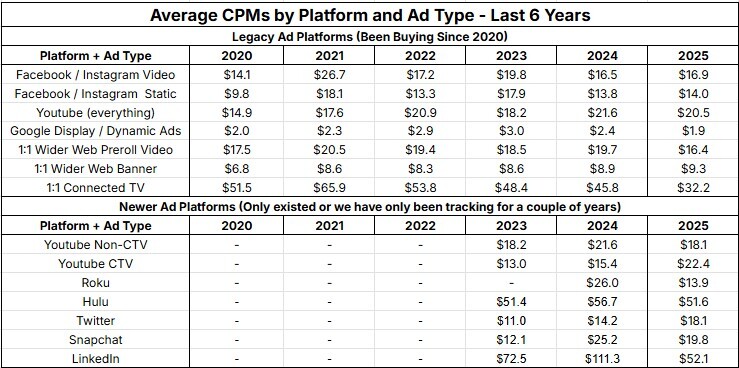
That’s why we like to share these annual price trend updates – we believe that getting these gritty details right leads directly to more votes won from paid media campaigns. As part of our ongoing effort to monitor media efficiency, we’ve completed our annual review of CPM trends, and we are ready to share so you can benefit from our insights too. The following data is compiled from the 111 campaigns we ran last year, augmenting the rest of our data and analysis dating dating back to 2020.
A few clear patterns are emerging that are shaping how we media plan going into the 2026 election season.
High-Level Takeaways:
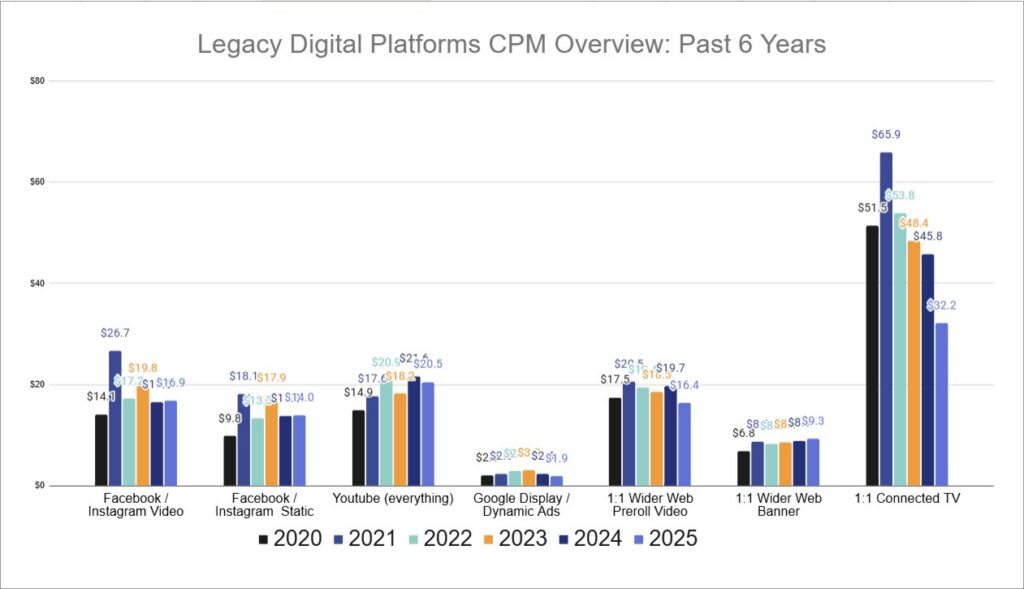
- We saw prices fall on most Streaming TV platforms (Youtube, 1:1 Targeted CTV in Demand Side Platforms, Roku, Hulu/Disney), likely a result of the increased overall Streaming TV supply powered by the great American chord-cutting migration.
- Prices for other types of Digital ads (Internet, Social Media) are, in aggregate, holding steady.
- Newer ad platforms (Roku, Hulu/Disney) are displaying less price variation campaign-to-campaign than older ad platforms (Meta, Google/Youtube, Demand Side Platforms). This makes the newer platform’s price easier to predict.
Read on if you want to get into the gritty details with us!
Reviewing price fluctuations within media platforms and types
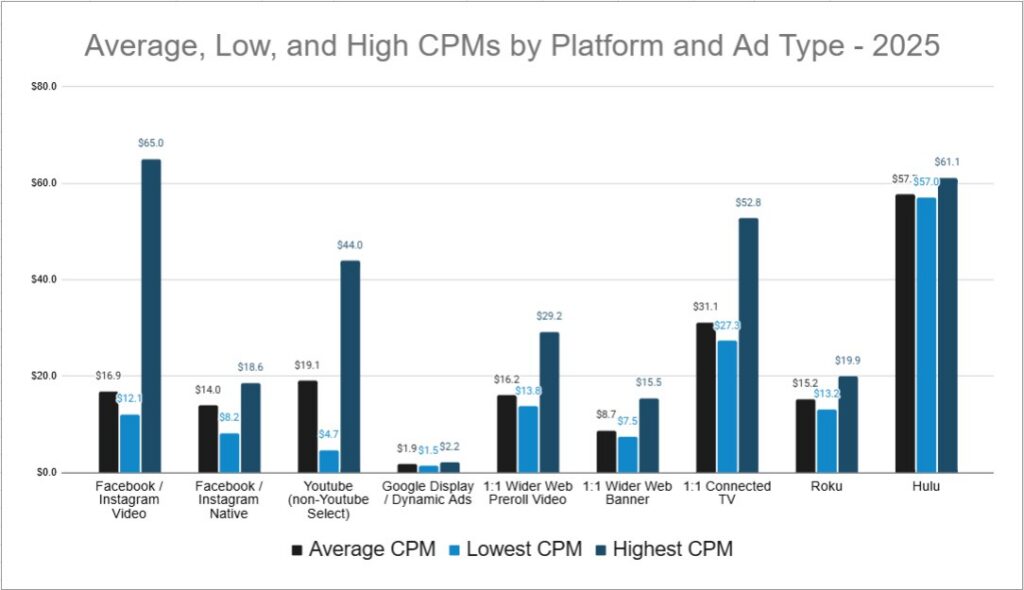
The following graph shows the Average, Low, and High CPMs we paid in 2025 on the various ad platforms and types we buy:
And this table provides additional details on what kind of campaigns yielded the low and high price marks:
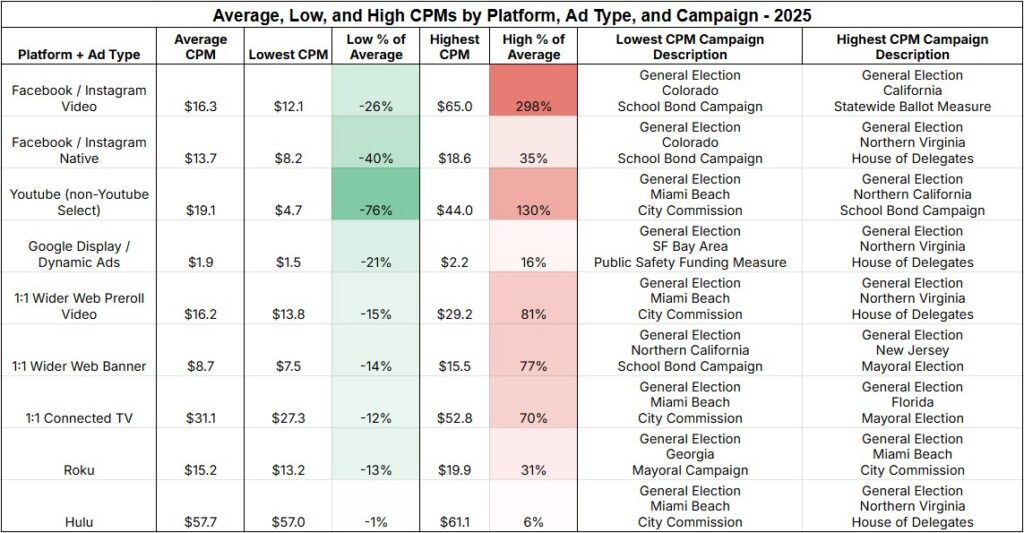
Facebook/Instagram and YouTube continue to show the most CPM variability, with large fluctuations from campaign to campaign. Facebook/Instagram video averages around $16 CPM, but individual campaigns range from $12 on the low end to as high as $65, quadrupling the average cost. Some of our lower cost campaigns were in less competitive local races, while campaigns in states with big top-of-ticket races (Virginia, New Jersey) and more overall elections are on the higher end. No surprise – more demand, higher prices.
Large price variation on these platforms isn’t surprising, and tracks with our data from last year. Legacy Digital ad platforms like Meta and Google offer extensive customization options, targeting levers, and campaign objectives, which can lead to wider swings in pricing. Campaign location, competitiveness of the race, and timing (primary vs. general) also influence what we ultimately pay. Additionally, we suspect that these platforms are set up to be more “pure” auctions than some of the newer ad platforms, with less built-in price floors and ceilings.
On the other side of the spectrum, pricing on the newer Connected TV platforms like Roku and Hulu / Disney Ads Manager keeps to a tighter range. While factors like geography and target audience size still matter, newer CTV platform CPMs tend to fluctuate within a narrower range than what we see on Meta or Google. Hal Varian, the original architect of the Programmatic Ad Auction, would have a thing or two to say to the folks in charge of auction pricing mechanics at these companies.
Finally, media bought through Demand Side Platforms (1:1 CTV, 1:1 Wider Web PreRoll, 1:1 Banners) falls in the middle of the old and new big-name “Walled Gardens” in terms of its price variation.
Analyzing newer Premium CTV auction prices
The Connected TV ecosystem continues to expand, with new inventory entering the market at a steady pace. As supply increases, prices have gradually trended downward. We don’t expect this to slow down in 2026 as more Americans cut the cord and increase time spent on their various streaming platforms of choice.
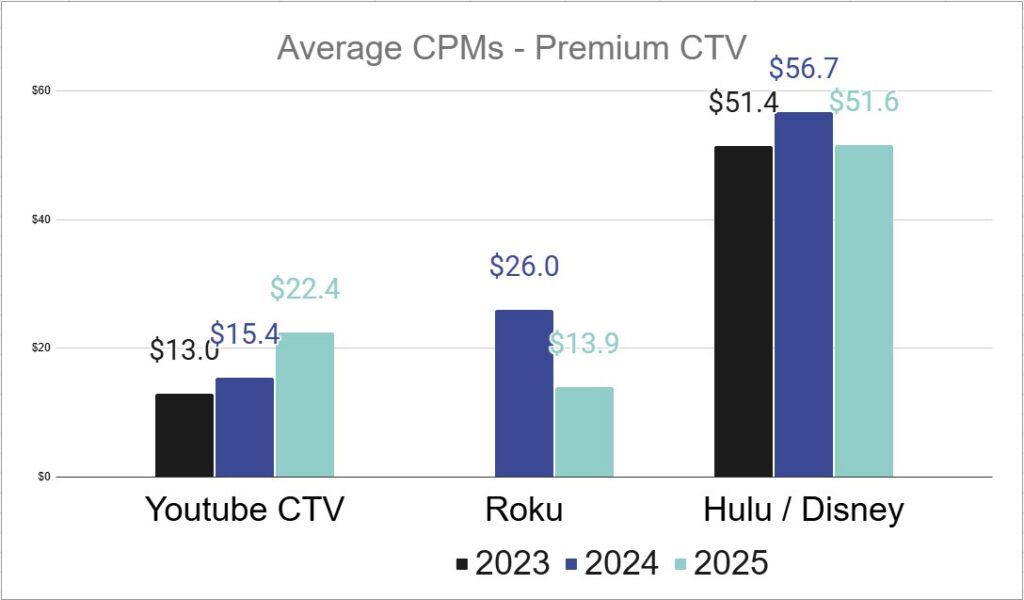
Roku Ads Manager CPMs nearly halved from 2025 to 2024 – and it was already ranking as one of our most efficient buys (Television quality media at the same price as Social ads? Yes please!). Meanwhile, Hulu / Disney prices reverted to 2023 prices after a significant increase in 2024. This may be a result of the Hulu Ads Manager becoming Disney Ads Manager, with more Disney supply coming into the market to take the aggregate price down.
Meanwhile, on Youtube, it looks like advertisers finally wised up to being able to selectively bid more for ads on Smart TVs as opposed to computers or phones – this is the first year that “Youtube CTV” prices (Youtube on a Smart TV) are higher than the average Youtube placement within our data set.
The many types of Youtube
Cutting through the price fluctuations noise across the many types of Youtube – at the aggregate level, Youtube CPMs dropped 5% from 2024 to 2025 (from $21.6 to $20.5), even as more valuable media (30s Non-Skip) began to enter the auction. That’s good news for advertisers adapting to YouTube’s increasing market share (about 2% more of TV-style media watching occurs on Youtube Main than it did in November 2024, according to Nielsen).
Let’s take a look at price variation across the ever-expanding types of spots available on Youtube:
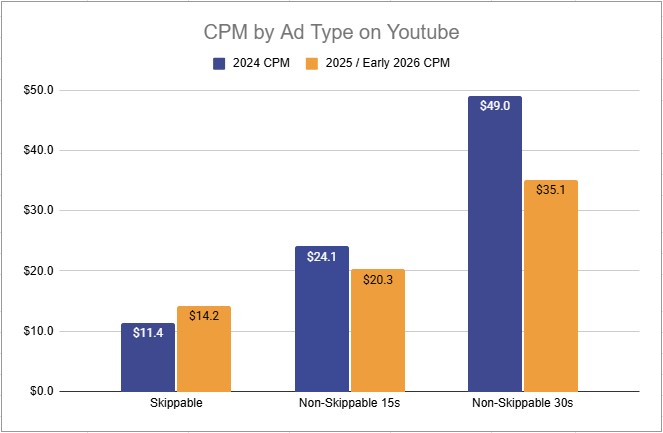
Youtube recently rolled out 30s non-skippable inventory in the auction, without requiring reservation and a guaranteed payment through Youtube Select to get access. The auction also allows for standard Youtube targeting options (better than the more restricted options on Youtube Select) and doesn’t require a $35k minimum spend to participate, like Youtube Select does. For a couple of months, in-auction 30s Non-Skip was really buggy – it essentially didn’t work. But, in February, Google must have pushed some sort of update to their ad platform, as we were able to get 30s Non-Skip in the auction for the majority of our campaigns.
We’ve only run a few campaigns with 30s Non-Skip in auction to date, and are finding it offers the standard trade-offs one might assume:
- On the plus side, CPMs are significantly lower (in the $20-$30 range as opposed to $45-55 for Youtube Select)
- On the negative side, there appears to be less “Premium” inventory (such as MSNOW and CNN, always in high demand in Primary election times as we are now), which Youtube is still holding in reserve for Youtube Select
In aggregate, it’s good to see the 30s Non-Skip overall price being driven down by integration into the auction – voters watch more than just the premium cable channels after all! We expect the price for auction 30s Non-Skip to increase as we get closer to the General and more advertisers incorporate it into their media mix, while still remaining undervalued overall and becoming a great new option for savvy buyers to harvest.
Turning to the old stalwarts of Youtube, 5 second Skippable and 15 second Non-Skippable spots, we see a couple of interesting trends:
- 15s Non-Skip followed the general trend of Streaming prices decreasing with increased supply
- Last year, we remarked how 5 second Skippable seemed to be so undervalued that it was worth buying more of. This year, it bucked the general Streaming trend and increased in price. The “Cost Per Second Watched” is a lot flatter than it was last year between Skippable and Non-Skippable, making us want to recant that conclusion.
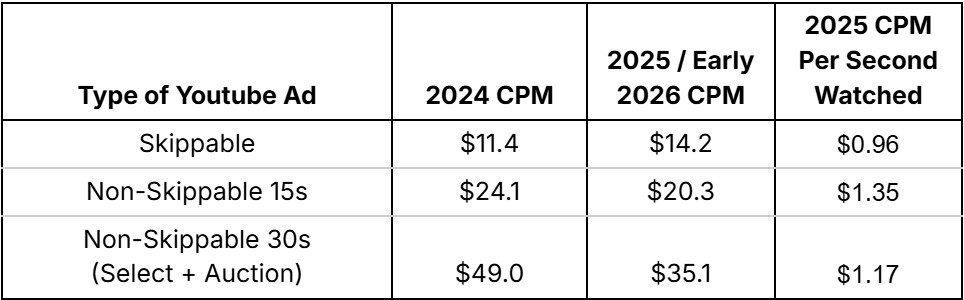
Our takeaway from this flattening of CPM per second watched is that we should lean back towards Non-Skippable media on Youtube, and we plan to go from around 70% of the average campaign’s Youtube spend going to Non-Skippable (our general goal last year) to, between the new 30s Non-Skip and older 15s Non-Skip, all Non-Skip commanding about 85% of total budget.
DSPs, how goes it with thee?
In addition to the many generic benefits DSPs provide, such as gaining access to a multitude of smaller suppliers who do not offer their own ad auctions, we political marketers get the added benefit of being able to target the voter file across many Connected TV and Wider Web placements. How did pricing for this DSP inventory evolve last year?
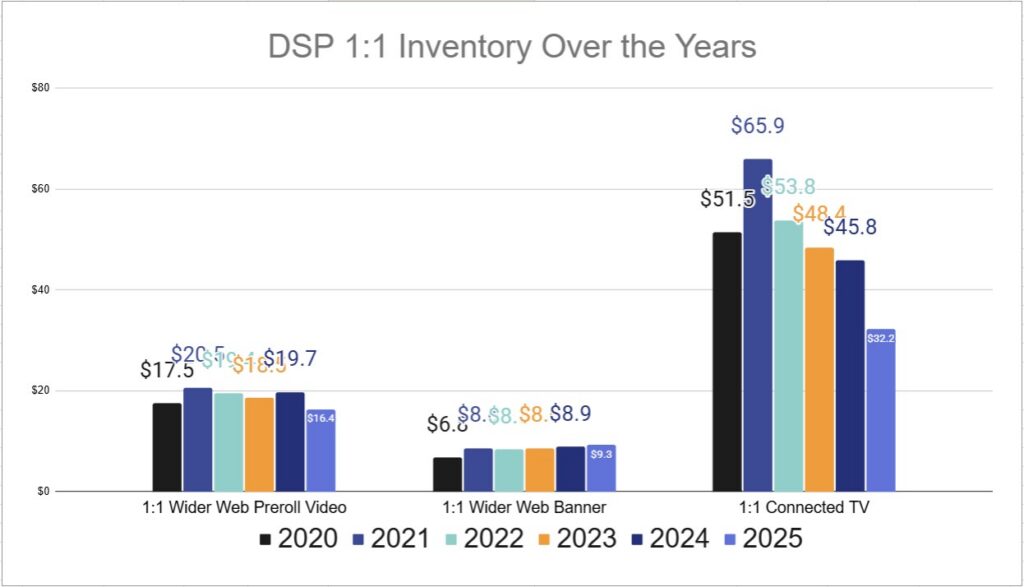
After persistent price decreases since 2021, the bottom seems to have really fallen out of 1:1 targeted CTV inventory last year. We consider this the most shocking aspect of our 2025 data. It is a testament to the increasing number of American voters who prefer to watch their on-demand content of choice on a free Smart TV app (in exchange for watching ads, of course), instead of whatever they were doing with their television time in the past. Demand for this inventory doesn’t seem to be keeping up with supply increases, thus the price drop. We’ll keep mopping up this media type for our clients, providing them with excellent prices on extremely targeted television-style media.
PreRoll Video, once the jewel of 1:1 media options available in a DSP, saw a marked price decrease after a number of years of flat prices. We don’t have a good theory for why this might be – our best guess is that folks would rather buy more of the increased supply of Streaming TV (which is probably a good call given Streaming TV price decreases across the board), yielding a demand decrease that dropped price for Wider Web PreRoll. Still nice to see this useful and targeted inventory become more efficient.
Meanwhile, Banner and Static media across the internet saw a small price increase. We’ll note that a lot of this media is becoming more motion-based, with HTML-5 ads easier to implement and hybrid static / video spots increasing in availability. These aren’t your grandparents’ banner ads – savvy creative shops can get more “message” into, and “vote value” out of, these spots than in days past.
Meta pricing flattens, other Social fluctuates
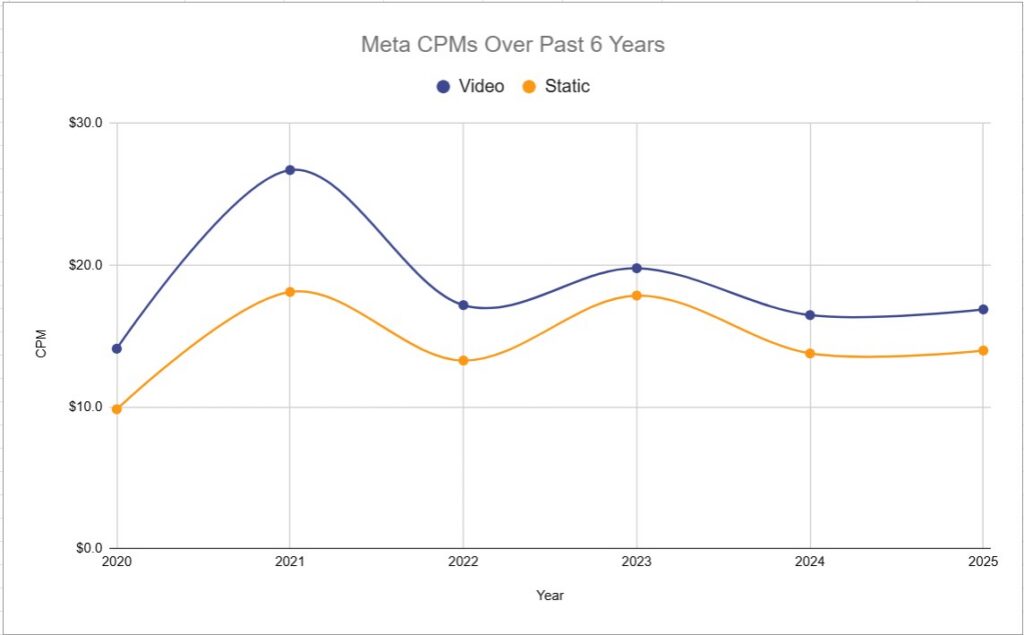
While Meta remains one of the more elastic platforms in terms of pricing from campaign to campaign, its average CPMs have stabilized in recent years. Even at the high price points its variable auction can yield, the combined reach of Facebook and Instagram, and the ability to target audiences using voter lists, continues to make Meta a core component of any effective Digital media plan.
Also worth noting that static media continues to come in at a bit lower CPM than video media. This is a steady trend that is consistent throughout all 6 years of our data.
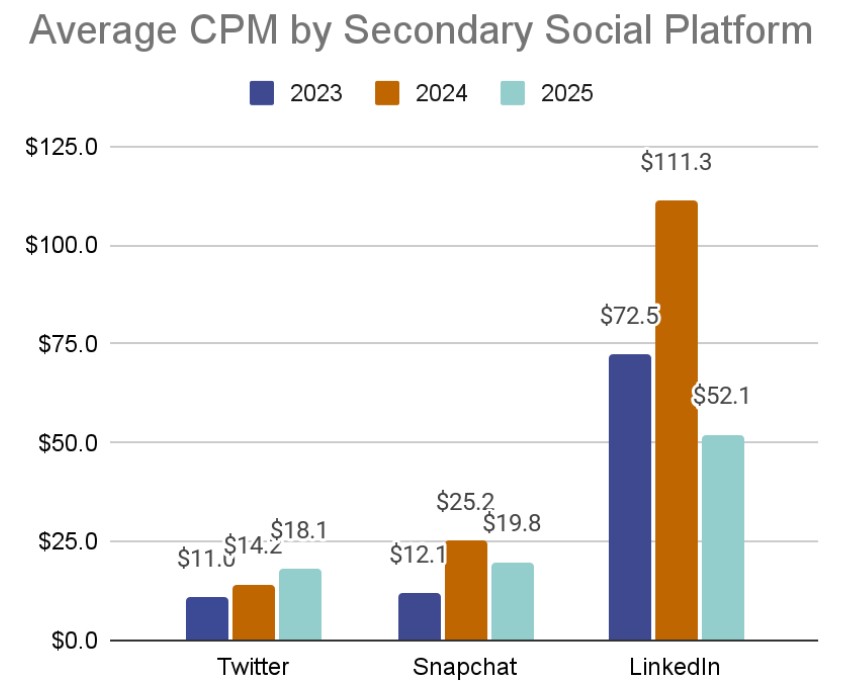
Our secondary Social platforms show a lot of variance over the past few years. This could be due to changes in their user base, mechanics shenanigans by their parent companies, or a quirk of our data set (we have fewer total campaigns on these platforms in the data set, creating larger error bars). Particularly in Twitter’s case (X if you must), which continues to change its auction mechanics and mess with its user base, we can’t put too much stock in these numbers as a meaningful trend.
Adjusting projections and a final salute to the hardcore
We are committed to rigorously evaluating the trends in this ever-changing landscape, and to helping our clients make better media plans by using this data to hone projections in our proposals. There are some wild fluctuations in our 2025 data set, and we tend to be a bit conservative in adjusting our projections so as to avoid making large mistakes when media planning. For example, we aren’t going to take 1:1 CTV projected price all the way down to our 2025 data average of a $33 base CPM. We believe that would run the risk of undersaturating an important part of our media mix if 1:1 prices were to normalize. All of our learnings and price adjustments will also be incorporated into our Media Buying Tool to enhance its projections as well.
We’d also like to tease that, coming very soon, there will be some big improvements to the Media Buying Tool that we hope will make it even more useful to folks looking to build better media plans for their campaigns in the all-important 2026 General election.
For those of you who made it this far, we salute you sweating the details with us. Happy media planning in our brave new world, and here’s hoping that these learnings help us keep democracy a thing after this year.
Zach Mandelblatt
President
Zach@CompeteEverywhere.com
Pooja Patel
Director of Paid Media
Pooja@CompeteEverywhere.com
Notes on our data:
- The data in this newsletter are base costs that we paid to suppliers, before any media fees or consultant fees have been applied (either ours or partners that we buy for). End clients can expect to pay between 15% and 40% more than these prices, depending on the details of how their consultants help them get their media to market.
- The overwhelming majority of this data comes directly from in-platform programmatic ad auctions, be it through a walled garden or a Demand Side Platform.
*** Obligatory acknowledgment that lower price is not always better if it means losing out on important inventory to the target audience, and that there are plenty of times in competitive elections that political advertisers should be willing to pay a high price.