Preparing for 2024 by Analyzing 2023
Once or twice a year, we aggregate and share the base price data from the hundreds of Digital ad programs we run for our campaigns, causes, and partners we work with. We believe this exercise:
- Helps us by allowing us to build better programs for our clients
- Helps our clients better understand why we are making the decisions we make and gives them a peek into the Digital “black box.”
- Helps the general Left-of-Center Poli-Digi ecosystem more broadly by putting out a resource for folks to spot-check the pricing they are getting from other vendors across the space
For a longer preamble on the value of this data, read the preamble from our August 2022 blog post on this same subject.
As we head into a momentous 2024, we again want to reflect on the last year’s data and share our thoughts. Our quick summary of the year is “The Growth and the Steadying.”
The Growth
Simply put, Digital ad supply has increased. In July of 2023, Nielsen reported that for the first time ever, Linear TV viewing dropped below 50% of total TV usage. That means that over half of TV Usage has moved to channels where advertisements are best purchased through Programmatic Real-Time Auctions. More TV usage happened in places where ads are purchased by folks sitting at their computer “playing the Digital ad video game,” like the woman in the graphic on the right below, as opposed to the Traditional Linear method, personified by the man on the left.
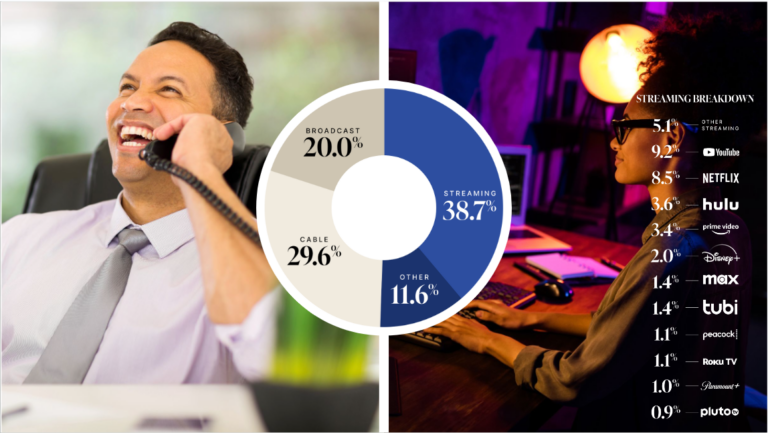
Supply isn’t up just on Connected TV and OTT Digital platforms – it is also increasing or holding steady on Social Media and other places throughout the internet. As the world changes, it is moving “our way” – with more Digital supply, the skill of navigating real-time Programmatic Ad Auctions is becoming more essential to getting Media in front of audiences.
The Steadying
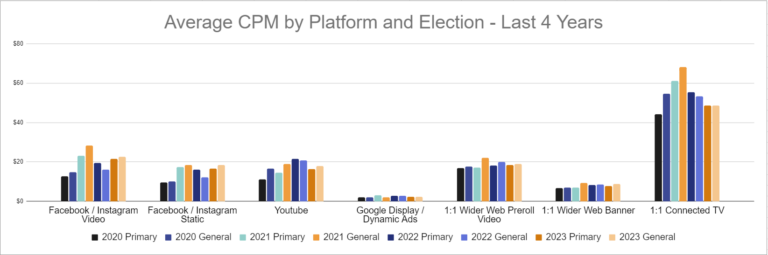
After a tumultuous 2022 upended by unforced errors, market uncertainty, and inflation, 2023 Digital ad prices seem to be acting “more normal” to us – there have been fewer shocks to the system. Platform prices are behaving more in line with what textbook Economic theory says they should be doing. On platforms where supply has been flatter (like Meta), prices increased some – as one would expect prices to do over time in a market with fixed supply. On platforms where supply has increased (like Youtube and 1:1 CTV), prices have dropped or leveled out. Supply up, demand steady = prices go down! We’ll see what 2024 brings, but we are expecting prices to follow a similar trend for this year (unless the long-forecasted recession finally comes).
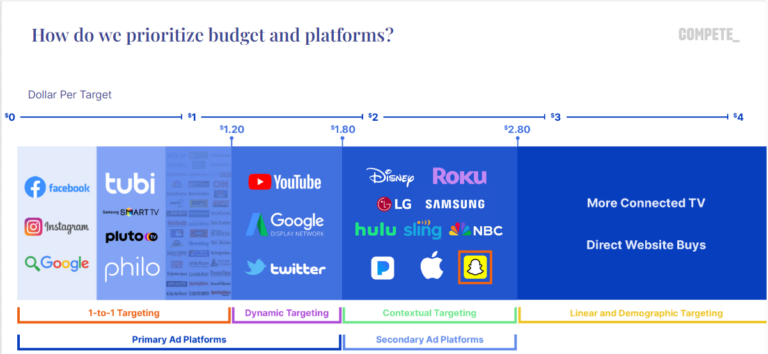
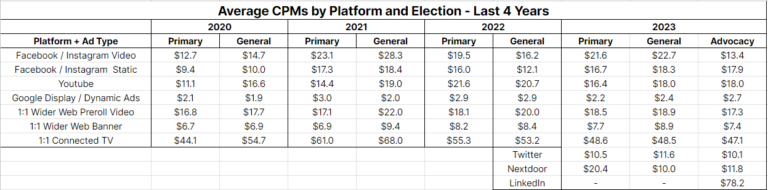
Let’s dig into trends on the individual platforms our data focuses on – the “Primary Ad Platforms” that we believe offer Poli-Digi Advertisers the best combination of price, quality of inventory, and ability to target – and thereby are the most efficient Digital advertising buying options for the strong majority of campaigns.
Connected TV
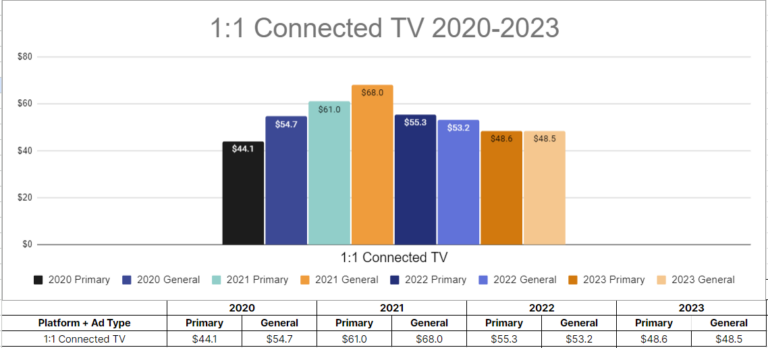
Connected TV price continues to drop from its 2021 peak. We believe this is mostly driven by 2 factors increasing supply:
- The CTV platforms that already allowed 1:1 targeting, like Samsung TV, Pluto, and Philo, grabbed more market share.
- Other CTV platforms are “getting with the times” by enabling advertisers to use 1:1 data to target. This year we have started to see HBO Max, NBC Universal, Discovery Plus, and many other CTV platforms for Legacy providers showing up towards the top of our CTV Placement reports for the first time.
We expect this increase in supply to continue as more Americans cut the cord, and as more CTV suppliers realize they are losing budget to competitors that give advertisers more sophisticated target capabilities and add 1:1 targeting functionality.
Youtube
Youtube, and all its variations, has continued its upward trend. It has grabbed more market share – one of the most surprising parts of the July Neilsen report is that Youtube now commands 9.3% of all TV Usage. That’s about 43% of all Broadcast TV Usage (!!!), which commanded only 20% of the market. Now, I would be neglecting my duties as a political hack if I did not add the heavy caveat that the folks on Broadcast TV are obviously older and obviously more likely to vote than the folks on Youtube, who skew much younger. But, we are seeing older demographics moving over to Youtube – it’s not just the kids accounting for the increase (Aside: you can target by age on Youtube, so a competent Digital advertising partner can (mostly) prevent you from targeting ads to kids).
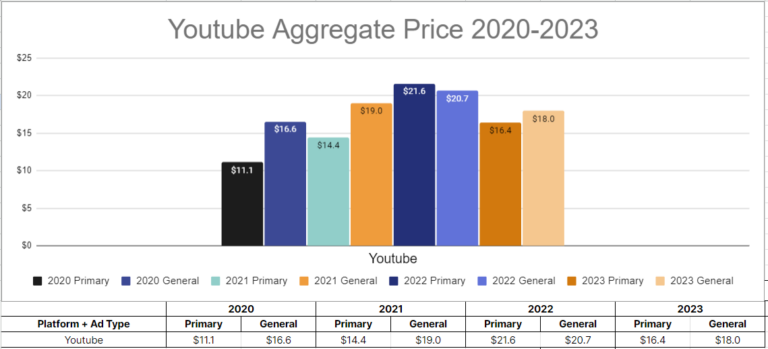
This increase in Youtube supply is likely fueling the decrease in price from 2022 to 2023, although the size of the decrease (10-15%) is stark and feels like it might be a quirk of our data. We’ll see what happens in 2024.
Youtube is such an interesting part of the market that we think it deserves a deeper look.
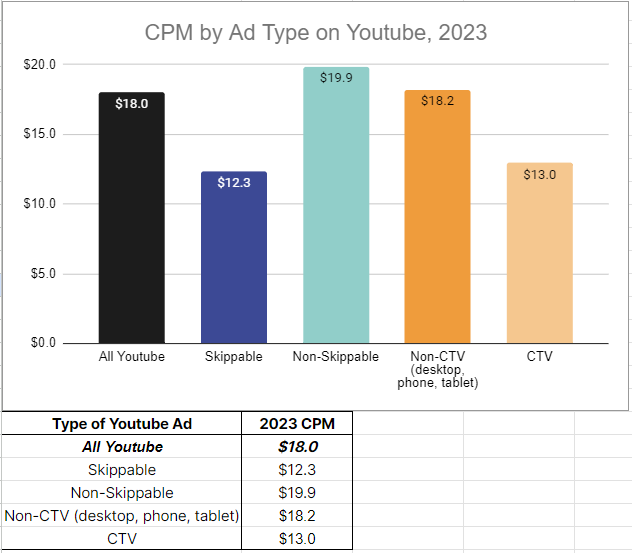
Some quick definitions:
Skippable: Ads that can be skipped after 5 seconds
Non-Skippable: Ads that must be watched until the end. On Youtube, these ads are always 15 seconds long.
Youtube CTV: Ads displayed on a Smart TV through Youtube or Youtube TV
Non-Skippable is a more valuable spot, so it’s not a surprise to see it costing 61% more than Skippable in our data.
For me, the biggest surprise in our 2023 data was seeing that Youtube CTV ads were significantly cheaper than Desktop, Phone, and Tablet ads. At first, I assumed this is a result of most of our Youtube CTV inventory purchased being Skippable, as the Skippable and CTV prices are very similar. This was not the case – 37% of our Youtube inventory purchased was CTV, while only 20% was Skippable. It does appear that, for whatever reason, buying Youtube CTV directly through Google Ads (what we do) is actually cheaper than buying other types of Youtube. This makes no sense from an “inventory value” perspective – typically, the bigger the screen, the better the spot! But, we won’t complain about this market inefficiency that we can take advantage of.
Our data makes one thing clear: Youtube should be commanding a higher % of Digital Media budgets. It offers a growing market share. It offers a low price ($13 for CTV inventory versus $48 for 1:1 CTV on other platforms), and although it doesn’t offer 1:1 targeting, the targeting suite available to sophisticated digital advertisers in Google Ads is very strong and dynamic. We believe it has cemented its place in the first tier of platforms that Poli-Digi advertisers should be considering.
Meta
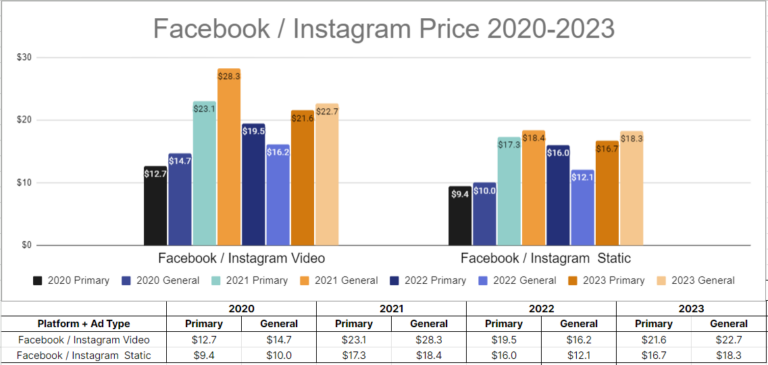
There was a time when Facebook and Instagram were always the first things we’d lead this newsletter with, but times change. The whole ill-advised Metaverse shift also has something to do with that. Over the course of 2022, Zuckerberg reacted wisely to the universal panning of his Metaverse plans and shifted the parent company’s focus. This steadying of the ship had positive benefits for its main platforms by:
- Halting the exodus of users from Facebook and Instagram. We have not seen a meaningful decrease in the % of target audiences that are “saturable” on Facebook and Instagram over the past couple of years.
- Inducing advertisers to return to Facebook and Instagram after they fled in 2022, as we have seen prices for both Video and Static ads bounce back to close to 2021 levels.
It has also been opening up more types of inventory, like Instagram Reels, to political advertisers, which we like to see.
Now, Facebook’s cheap inventory, steady hold on its user base, and its same shameless willingness to sell all of its user data to advertisers have caused it to settle into place as a top-tier platform for Political and Public Affairs campaigns to utilize, even if it is no longer the Alpha and the Omega. Reports of Meta’s demise have been greatly exaggerated.
“The Internet” Inventory: Wider Web Preroll, Wider Web Banner Ads, and Google Display
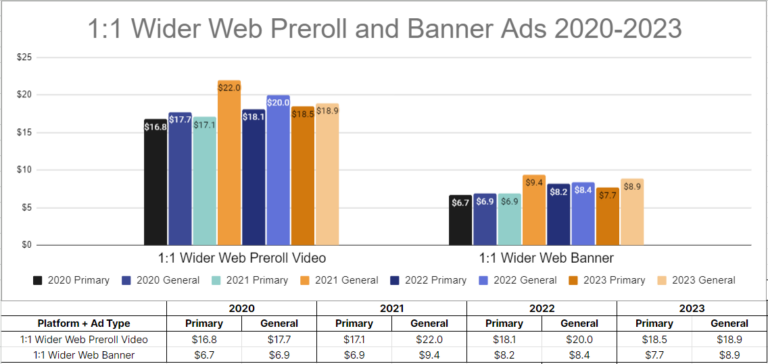
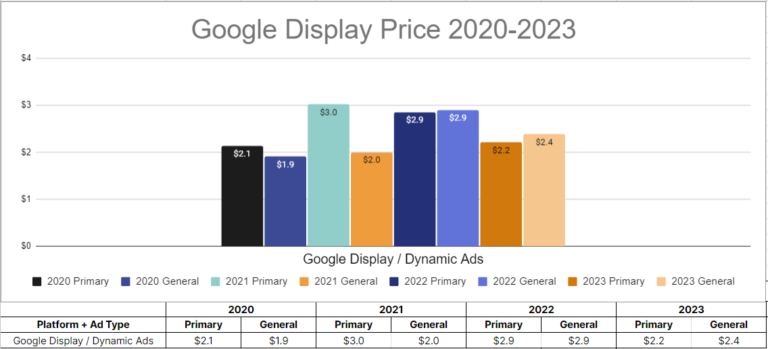
For the sake of brevity and grouping similar things, we’re putting these 3 ad types together. They are all “ads that are found on websites across the internet”, after all! And, they all share the trend of being about the same price, or slightly lower, than they were in 2022.
We recommend folks continue to mix targeting types, paying more for “better” targeted ads that use 1:1 data while seeking out the lowest cost-per-unit options that offer strong Dynamic targeting methods for static ads.
One interesting note about Google Dynamic Ads: they now allow for video ad usage! Yes, that’s right – you can get a bunch of video ads placed across the internet using Google’s suite of targeting for the low, low price of $2-3 per thousand ads. At some point, the “better targeting” of 1:1 is not worth paying a 4 times higher price. The “cost per spot” vs “targeting ability” trade-off is something we think about a lot, and try to blend all the options together in a manner that leads to the best total budget efficiency across all platforms.
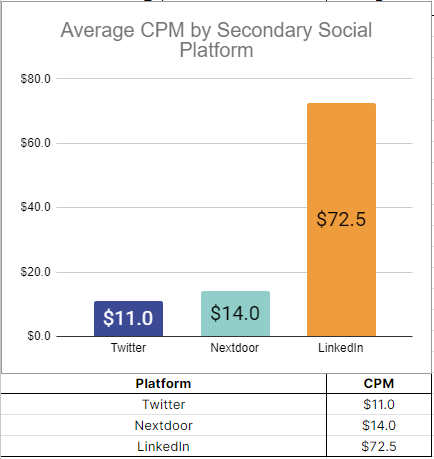
Secondary Social Platforms - Twitter, Nextdoor, LinkedIn
Lastly, we have some data to share on a few different social platforms that, for whatever reason – political ad cert bans, market share or targeting concerns, being owned by Elon Musk – don’t get as much tick from us, but that we still bought quite a bit of.
Twitter – sigh. We had high hopes for the bird platform this year, but Elon has done a good job of scaring off a lot of his user base, and it has really shown from a practical advertising perspective. There are noticeably fewer folks on Twitter than there used to be. We have also noticed its price increase from the $7-8 CPM range in previous years to $11 in 2023. This is likely driven, in some part, by us trying to spend too much on the diminished platform before realizing the extent of its diminishment. We’re now toggling down on Twitter for 2024, although we believe that, Elon grossness aside, it can still be a tool to reach a persuadable audience.
Also, we are doing our best to refuse to call it X.
Nextdoor had a brief stint on our Primary Ad Platforms list, as our fearless Director of Partnerships (and elected Modesto City Council Member) Chris Ricci tried advertising with it for his campaign and realized they don’t enforce their political ad cert ban. Unfortunately, Nextdoor wised up and improved their review process, and we are now only able to use it for Public Affairs campaigns.
LinkedIn continued to be an excellent asset for Public Affairs campaigns. We don’t mind the high CPM, as the professional class on LinkedIn is likely to have clout our Public Affairs clients are interested in messaging to, AND they let us 1:1 target. Paying more for a higher-value audience is worth it.
Wrap Up and Aggregate Data
If you’ve made it this far – you care about esoteric Digital ad prices as much as we do, and we thank and commend you 🙂
For the true sickos, below is aggregate data from all years for all platforms. We hope that this update will help you win more in 2024 – and if you ever want to chat about Digital, please reach out.
About our data: Our 2023 data is built off of about 75 different 2023 Electoral campaigns (separated by different target audiences), and about 40 different Public Affairs campaigns (same definition).
The plurality of our electoral data comes from Virginia campaigns, but also features quite a bit of California, New Jersey, and Kentucky, with a smattering of campaigns from the rest of the country. We do think that Virginia 2021 Digital prices run hotter than one would expect them to because of its “biggest off-year state” status, so we keep that in mind when using 2023 data to project future prices.
Our Public Affairs data is concentrated in New York, New Jersey, Texas, Pennsylvania, and California, but fairly spread out throughout the country other than those 5 states.
We placed about $3.1 Million total in ad buy throughout the year across all the Digital Ad Platforms featured in this summary.